
Understanding Counting Complexity in New Systems Engineering

Understanding Counting Complexity in New Systems Engineering
Introduction: Counting Complexity
In Systems Engineering, Counting Complexity shows that growth does not come only from adding parts. Instead, it comes from the relationships those parts create. For example, two parts form one interface. Add a third, and suddenly there are three. Add a fourth, and the count jumps to six. By the time you reach ten parts, the number of interfaces has already reached forty-five.
Moreover, this simple arithmetic explains why complexity feels exponential. Therefore, the parts increase in a straight line, but the connections grow on a curve. For engineers, this matters because every interface introduces requirements, validation steps, and potential failure points. As a result, without management of Counting Complexity, the system can quickly overwhelm the teams that design and verify it if careful management is missing.
Additionally, statistics make the invisible visible. Hence, they quantify why complexity grows, how requirements expand, and why verification burdens spiral upward. Therefore, interfaces must be measured as carefully as parts. More importantly, statistics reveal why physical testing cannot keep pace, and why virtual development has become essential in modern engineering practice.
Parts vs. Interfaces
To illustrate, the simplest way to measure growth is to compare parts with their interfaces.
- Two parts: one interface.
- Three parts: three interfaces.
- Four parts: six interfaces.
- Ten parts: forty-five interfaces.
The formula is:
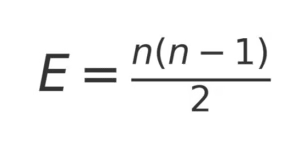
where:
E = the total number of possible interfaces (connections, links, or relationships).
n = the total number of parts (or nodes/components) in the system.
This equation shows that the more we add, the faster connections increase. A system of 100 parts has 4,950 possible interfaces. At 1,000 parts, the potential interfaces jump to nearly half a million. Even if the design is less dense, the potential shows why propagation spreads so easily in large systems.
| Parts (n) | Interfaces (E) |
| 2 | 1 |
| 3 | 3 |
| 4 | 6 |
| 5 | 10 |
| 6 | 15 |
| 7 | 21 |
| 8 | 28 |
| 9 | 36 |
| 10 | 45 |
Generally, other fields show the same pattern. Airlines add a modest number of aircraft, but the number of possible flight connections grows dramatically. Social media networks expand as each new user forms links with many others. Therefore, complexity increases faster than intuition suggests.
Overall, automotive engineers know this from wiring harnesses. Each new connector multiplies possible paths for signals and faults. With zonal E/E architectures, the challenge is sharper. Zone controllers interact with dozens of sensors, actuators, and peers, creating not only more parts but more critical interfaces that must align.
Requirements Expansion
Building on this, every part carries its own requirements. For example, an ECU may need ten functional and safety requirements just to define baseline performance. Every interface adds its own rules: signal ranges, timing tolerances, physical connectors, cybersecurity constraints.
We can express this as:
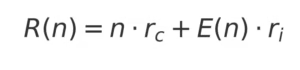
- R(n) = total number of requirements for a system with n parts.
- n = number of parts (components) in the system.
- rc = average number of component-level requirements per part.
- E(n) = number of interfaces in the system for a fully connected system.
- ri = average number of interface-level requirements per interface.
So:
The term n⋅rc covers the requirements from the parts themselves.
The term E(n)⋅ri covers the requirements from the connections between parts.
Together, this shows how requirements grow not only with the parts added but even more with the interfaces.
Therefore, suppose each component has ten requirements and each interface adds five:
Parts n | Component reqs | Interfaces | Interface reqs | Total reqs |
2 | 20 | 1 | 5 | 25 |
3 | 30 | 3 | 15 | 45 |
4 | 40 | 6 | 30 | 70 |
5 | 50 | 10 | 50 | 100 |
6 | 60 | 15 | 75 | 135 |
Visibly, the numbers climb quickly. Even in this simple model, interface requirements dominate by the time you reach six parts. Engineers often underestimate the workload because each new part adds more than itself—it adds all its links.
In ADAS integration, this is obvious. Adding a driver-monitoring camera may look like one part. But interfaces—CAN bus data, displays, power supply, cybersecurity checks—add requirements. By the end, the count is several times higher than the part alone suggested.
Verification and Validation Burden
Consequently, every requirement needs verification, and many need validation. If each requirement receives at least one test, the test count scales with the same curve. In practice, most requirements demand multiple tests across conditions, so the burden grows even faster.
Furthermore, this creates the combinatorial explosion. Ultimately, testing every possible state is impossible. For example, a subsystem with 20 binary options has more than one million combinations. Exhaustive testing cannot be done.
In the systematic development processes, engineers use reduction strategies:
- Deduplication – merge duplicates and overlaps.
- Reuse – carry over validated parts and tests.
- Risk-based pruning – full validation for high-severity items, lighter checks for low-severity.
- Pairwise testing – cover all pairs, capturing most faults with far fewer tests.
- Equivalence classes – group similar input ranges.
- Boundary values – stress the extremes.
- Model-based testing – generate tests from system models.
- MC/DC coverage – confirm each logic condition is exercised.
In ADAS, lane-keeping may start with a handful of requirements, but each one expands into hundreds of test cases: curves vs. straights, day vs. night, clear vs. rain, intact vs. faded road markings. Requirements multiply; validation explodes.
Without structured reduction, V&V would swamp any program. Statistics show why discipline—not brute force—makes testing feasible.
DFSS and ppm Implications
In practice, the statistics also appear in quality metrics. In Design for Six Sigma (DFSS), the target is often six parts per million (6 ppm) defects per component. It sounds strict—until scaled to the vehicle.
If a vehicle has 2,000 critical parts, each at 6 ppm defect probability:
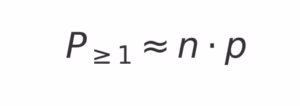
where:
P≥1 = probability that the system (assembly) has at least one defective part.
n = number of parts (or components) in the assembly.
p = probability that a single part is defective (often given in ppm, e.g., 6 ppm = 6×10⁻⁶).
For 2,000 parts, this is 1.2%. That means more than 1 in 100 vehicles may contain a defect. For 300,000 vehicles, that is more than 3,500 at risk.
An EV with 3,500 critical parts faces ~2.1% vehicle-level risk. In 300,000 vehicles, more than 6,000 could be affected.
To meet a vehicle-level 6 ppm target, the per-part defect rate must be divided by the part count. For 2,000 parts, that means ~3 ppb quality. For 3,500 parts, ~2 ppb. This is why OEMs demand ppb quality from suppliers on critical items.
Finally, the math proves that ppm numbers only matter when scaled. Without system-level thinking, ppm metrics can be misleading.
Role of Simulation
For this reason, simulation and working models are essential because physical testing cannot cover the numbers.
Furthermore, working models let engineers explore interactions before hardware exists, including means which are Counting Complexity. Built one step ahead of physical design, they reveal how requirements propagate and where failures might emerge.
Simulation capabilities exercise thousands of interactions virtually. A change in software or a new interface can run across all affected modules in hours instead of weeks. The crucial point is correlation: simulations must match physical validation. When they do, simulation keeps verification manageable and prevents uncontrolled propagation.
This parallel development—simulation leading hardware—creates a buffer. Instead of validation becoming a bottleneck, it becomes continuous and predictive.
Conclusion: Counting Complexity
Ultimately, Counting Complexity explains why growth feels overwhelming. Parts add in a straight line, but interfaces and requirements accelerate. Verification and validation expand with the same patterns, and ppm goals that seem strict at the part level collapse when scaled to vehicles.
The lesson is clear: interfaces, not parts, drive most growth. Statistics reveal this hidden curve and prove that intuition is not enough. Without working models and simulations, verification would be impossible. With them, engineers gain foresight to manage complexity before it spirals.
Continuing, the next article follows these interactions further, showing how once complexity enters a system, it spreads—Complexity Propagation.
References
-
INCOSE Systems Engineering Handbook – Overview of systems engineering principles, including V-Model context
www.incose.org/products-and-publications/se-handbook -
ISO/IEC/IEEE 15288: System Life Cycle Processes – International standard defining system development and verification processes
www.iso.org/standard/63711.html - 3. ISO 26262: Road Vehicles – Functional Safety – Automotive functional safety standard where the V-Model is often applied
www.iso.org/standard/43464.html
References to Complexity in Systems Engineering Series:
- What Do We Mean by Complexity?
- The Growth of Complexity
- Counting Complexity – Why Interfaces Grow Faster Than Parts <—You are here
- Propagation: How Complexity Spreads
- Complexity Reduction: The Discipline of Simplification
- Optimization: Improving the Existing System
- Requirements: The First Line of Defense
- Measuring and Managing Complexity
- From ppm to ppb – The Statistical Reality of Vehicle Defects
- Complexity in Practice: Case Studies & Critiques
Simulation and Virtual Models – Managing Complexity in Verification and Validation
Systems Engineering References
About George D. Allen Consulting:
George D. Allen Consulting is a pioneering force in driving engineering excellence and innovation within the automotive industry. Led by George D. Allen, a seasoned engineering specialist with an illustrious background in occupant safety and systems development, the company is committed to revolutionizing engineering practices for businesses on the cusp of automotive technology. With a proven track record, tailored solutions, and an unwavering commitment to staying ahead of industry trends, George D. Allen Consulting partners with organizations to create a safer, smarter, and more innovative future. For more information, visit www.GeorgeDAllen.com.
Contact:
Website: www.GeorgeDAllen.com
Email: inquiry@GeorgeDAllen.com
Phone: 248-509-4188
Unlock your engineering potential today. Connect with us for a consultation.