
From ppm to ppb: New Vehicle Engineering – Defects Explained

From ppm to ppb: New Vehicle Engineering - Defects Explained
Introduction: Why ppm Is Not Enough
In modern automotive engineering, the discussion of quality increasingly turns to the shift from ppm to ppb. Quality is often measured in ppm—parts per million. At first glance, ppm appears to be an extraordinarily strict benchmark. A supplier who delivers only six defects per million parts seems to have achieved near perfection. Yet when thousands of such parts are assembled into vehicles, the math reveals that ppm is not enough. However, to control system-level risk, expectations must move to ppb—parts per billion.
Furthermore, this leap is not arbitrary. It emerges from how probabilities scale across complex systems. A defect rate that looks negligible in isolation compounds when multiplied across thousands of components, producing vehicle-level risks that are far higher than intuition suggests. A single vague requirement, one weak sensor, or a minor process variation may appear trivial, yet when spread across thousands of vehicles, the outcome becomes significant.
Hence, the System Defect Probability Equation makes this relationship explicit. It shows that even with ppm-level quality at the part level, system-level risks quickly escalate into percentages at the vehicle level. Only by shifting to ppb expectations can OEMs and suppliers contain complexity and deliver the reliability demanded of modern vehicles.
Defects in Context: ppm Defined
To begin with, engineers need a clear definition of ppm before exploring why it falls short. **ppm—parts per million—**expresses the number of defective items in one million units produced. For example, six ppm means that, on average, six out of every million parts will fail to meet specification.
Moreover, in quality management, ppm became a common benchmark during the rise of Six Sigma methodologies. In addition, Six Sigma translates to about 3.4 defects per million opportunities, setting a high bar for precision. Therefore, in automotive supply chains, similar ppm measures were widely adopted to assess component reliability and to drive continuous improvement.
At the part level, ppm appears almost unshakable. A defect rate of six parts per million equals a success rate of 99.9994%. For a single supplier producing large volumes, this performance looks like excellence. Furthermore, it provides a standard that OEMs can easily compare across multiple suppliers.
However, complexity challenges this comfort. A modern vehicle does not consist of one or two parts but thousands. Each part carries its own small but real probability of failure. When these probabilities combine, the system risk grows. The leap from component quality to vehicle reliability requires moving beyond part-level ppm thinking to a full statistical understanding of how defects scale.
Thus, ppm serves as a useful starting point, but it does not capture the full reality of modern engineering systems. It measures isolated performance, not system outcomes. To understand reliability at the vehicle level, engineers must calculate how ppm defects accumulate across thousands of components—an exercise that reveals why ppm, by itself, is not enough.
Scaling Up: From Part to Vehicle
When engineers talk about quality, the discussion often begins with defects per million opportunities (ppm). At the part level, a target of 6 ppm sounds strict—only six defects in a million. Yet when thousands of parts come together in a vehicle, the math tells a different story.
In fact, the key lies in the System Defect Probability (SDP): the chance that an assembly of many parts contains at least one defect. If each part has an independent defect probability , and the assembly has parts, the probability that the system has at least one defective part is:
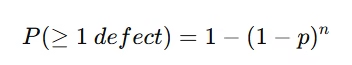
System Defect Probability (SDP)
where:
- p = probability of at least one defective part in the assembly
- P = defect rate per part (in ppm or ppb)
- n = number of parts in the system
The probability that an assembly with parts will contain at least one defect. Even with very small per-part defect rates, the overall risk grows quickly as increases.
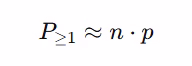
For small values of p, this simplifies to a rule-of-thumb:
Numerical example:
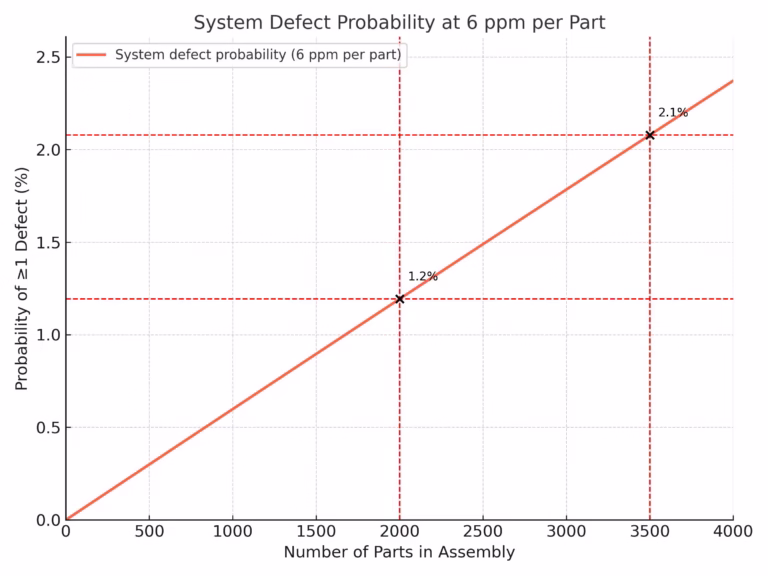
Generally, the System Defect Probability equation makes the effect of scaling visible. For a vehicle with 2,000 critical parts, each at a defect rate of 6 ppm, the probability of at least one defective part is about 1.2%. Furthermore, increasing the system to 3,500 parts raises that probability to 2.1%. These values may look small, but at fleet scale the impact is dramatic—out of 300,000 vehicles, thousands could contain a defect even when every supplier meets a 6-ppm target.
The Leap from ppm to ppb
The math leads to a simple but uncomfortable truth: the leap from ppm to ppb is unavoidable. Six ppm at the part level does not translate to six ppm at the vehicle level. Once thousands of parts come together, the cumulative risk grows into percentages, not fractions of a percent. This is why programs that appear compliant at the component level still suffer failures when scaled to vehicles.
Overall, to meet a vehicle-level target of 6 ppm, the per-part target must be divided by the number of critical parts. Moreover, using the rule-of-thumb, a system with 2,000 parts requires each part to perform closer to 3 parts per billion (ppb). With 3,500 parts, the requirement tightens further to about 2 ppb. In essence, what sounds extreme is, in practice, the only way to keep the overall system risk at ppm scale.
Therefore, this is not an academic exercise. Automotive semiconductors, battery cells, and safety-critical electronics all operate under these expectations. Suppliers cite “zero defect” initiatives and document ppb-level performance to win sourcing contracts. Standards such as AEC-Q004 Zero Defects, IATF 16949, and AIAG APQP/PPAP formalize these expectations, making the leap from ppm to ppb an operational requirement rather than a theoretical ideal.
Consequently, the lesson is straightforward: ppm thinking is not enough once systems reach vehicle scale. At thousands of parts, only ppb-level quality ensures that fleet-level risk remains manageable.
Managing Quality at Scale
Initially, recognizing that ppm cannot hold at vehicle scale is only the first step. The harder challenge is building systems that actually deliver ppb-level outcomes. Here, quality management frameworks provide the discipline to bridge theory and practice.
Supplier quality systems anchor this effort. Standards such as IATF 16949, APQP/PPAP, and OEM-specific sourcing requirements define how suppliers prove capability and maintain consistency. In fact, these processes are not paperwork; they are statistical filters that push defect probabilities down before parts ever reach the assembly plant.
Engineering tools reinforce the system-level perspective. Failure Mode and Effects Analysis (FMEA) prioritizes risks based on severity, occurrence, and detection. Statistical Process Control (SPC) tracks variation in real time, alerting teams when trends threaten quality escape. Therefore, both provide quantitative visibility into how complexity translates into potential defects.
Zero Defects initiatives, exemplified by AEC-Q004 in the semiconductor domain, highlight the cultural and technical shift required. Instead of treating defects as inevitable, suppliers commit to continuous improvement toward ppb-level quality. In addition, this shift reshapes expectations: detection is no longer enough; prevention becomes the standard.
Fundamentally, at the OEM level, fleet scaling drives accountability. A single defect rate, when multiplied across hundreds of thousands of vehicles, quickly becomes a recall or warranty crisis. By linking per-part quality metrics directly to vehicle-level risk, leaders enforce the discipline required to hold suppliers—and themselves—to ppb outcomes.
Ultimately, managing quality at scale is about alignment. Math reveals the risk, but only integrated standards, tools, and culture can suppress it to acceptable levels. Without that alignment, ppm targets remain an illusion; with it, ppb quality becomes achievable.
Automotive Examples: From ppm to ppb in Practice
The transition from ppm to ppb is not abstract. Automotive programs encounter it constantly in high-volume, safety-critical domains where even a tiny defect rate cascades into thousands of failures at the fleet level.
Semiconductors. A microcontroller with millions of transistors may ship at 6 ppm quality per device. But when thousands of devices populate vehicles, the fleet-level defect probability balloons. This is why automotive-grade silicon follows AEC-Q004 Zero Defects and similar standards, driving suppliers toward ppb-level defectivity and embedding prevention into design and manufacturing processes.
Battery cells. Electric vehicle battery packs contain thousands of cells. A defect rate of just a few ppm per cell translates into multiple defective cells across large packs or fleets. Because one defective cell can compromise an entire pack, OEMs demand ppb-level quality metrics and employ cell-level statistical sampling, combined with system-level protections, to mitigate risk.
Safety-critical ECUs. Systems such as airbag controllers, brake modules, and ADAS domain controllers must meet defect probabilities that align with ISO 26262 functional safety expectations. Here, part-per-billion thinking is implicit. A single escape can undermine not only customer safety but also brand reputation.
Assembly lines. The same logic extends beyond components. In final assembly, if each station has a ppm-level escape risk, the compounded probability across hundreds of stations drives the effective rate into percentages. Manufacturers counter this with layered error-proofing (poka-yoke), statistical controls, and robust rework processes to keep vehicle-level escapes rare.
These examples demonstrate that the leap from ppm to ppb is not optional—it is enforced daily by the physics of scaling. Only by recognizing and addressing this multiplication can engineering and manufacturing programs meet modern quality and safety expectations.
References: Applications of ppb Quality
- Automotive Semiconductors
- Producers: NXP, Infineon, Renesas, Texas Instruments
- Process: Wafer fabrication, assembly, and test under AEC-Q100 and AEC-Q004 Zero Defects
- Note: ADAS and safety ECUs require defectivity approaching ppb levels
- EV Battery Cells
- Producers: LG Energy Solution, Panasonic (Tesla), CATL
- Process: Electrode coating, stacking, electrolyte filling, inline inspection, formation cycling
- Note: Defect rates must be near ppb because one defective cell can compromise an entire pack
- Airbag Inflators & Safety ECUs
- Producers: Autoliv, ZF TRW, Joyson Safety Systems
- Process: Inflator assembly with 100% inline testing, X-ray inspection, ECU end-of-line tests
- Note: Safety-critical content drives effective escape levels toward ppb
- Tier-1 Electronics Assembly
- Producers: Bosch, Continental, Denso
- Process: PCB assembly (SMT), AOI, in-circuit and functional testing, ISO 26262 ASIL-D compliance
- Note: Outgoing quality in safety programs enforced at ppb-equivalent levels
Philosophical View: From Chaos to Responsibility
The leap from ppm to ppb is more than a statistical adjustment; it is a philosophical shift in how engineers think about risk, probability, and responsibility.
Risk reflects the reality that no system is perfect. Every part carries some chance of failure, and thousands of parts amplify that risk into a meaningful system-level exposure. The System Defect Probability Equation makes this visible: what looks negligible at the part level becomes significant at the fleet level. Risk cannot be eliminated, but it can—and must—be bounded.
Probability reframes engineering from deterministic to probabilistic thinking. Chaos Theory teaches that small variations in initial conditions can produce disproportionate effects. Systems Engineering responds with structured methods—requirements, verification, and change control—that push risk into predictable ranges. Measurement provides the bridge: it translates uncertainty into quantifiable terms that allow foresight and planning.
Responsibility is the ethical dimension. A defect probability may be statistically acceptable, but its social consequences may not. In ADAS, for example, even a single failure can cost lives. Engineers and organizations therefore carry the responsibility to exceed minimal ppm targets, design for ppb performance where safety is involved, and communicate risks transparently across suppliers and OEMs.
Thus, the leap to ppb is not just about tightening numerical standards. It represents a deeper recognition that complex systems demand probabilistic reasoning, disciplined methods, and ethical accountability. Engineers must measure risk, manage probability, and own the consequences. Only by combining numbers with philosophy can complexity be controlled.
Conclusion: From ppm to ppb
Yet the numbers are not the whole story. Philosophically, ppm to ppb represents more than mathematical tightening. It is a shift in mindset: from ignoring risk to bounding it, from deterministic thinking to probabilistic reasoning, and from minimal compliance to ethical responsibility. This is why the shift from ppm to ppb becomes essential for modern automotive systems.
Practical disciplines—requirements clarity, change management, supplier quality systems, and robust simulations—are the tools that make this philosophy real. They translate abstract probabilities into controlled processes, where prevention replaces reaction and continuous improvement pushes closer to zero defects.
The lesson is consistent across semiconductors, batteries, and safety-critical ECUs: visibility creates control. By measuring risk with rigor, scaling quality expectations realistically, and embracing responsibility, automotive programs can move from ppm illusions to ppb realities.
The series continues with Complexity in Practice: Case Studies & Critiques, where we apply these principles to real-world examples, showing how complexity is measured, managed, or sometimes missed in practice.
References
-
INCOSE Systems Engineering Handbook – Overview of systems engineering principles, including V-Model context
www.incose.org/products-and-publications/se-handbook -
ISO/IEC/IEEE 15288: System Life Cycle Processes – International standard defining system development and verification processes
www.iso.org/standard/63711.html - 3. ISO 26262: Road Vehicles – Functional Safety – Automotive functional safety standard where the V-Model is often applied
www.iso.org/standard/43464.html
References to Complexity in Systems Engineering Series:
- What Do We Mean by Complexity?
- The Growth of Complexity
- Counting Complexity – Why Interfaces Grow Faster Than Parts
- Propagation: How Complexity Spreads
- Complexity Reduction: The Discipline of Simplification
- Optimization: Improving the Existing System
- Requirements: The First Line of Defense
- Measuring and Managing Complexity
- From ppm to ppb – The Statistical Reality of Vehicle Defects <—You are here
- Complexity in Practice: Case Studies & Critiques
Simulation and Virtual Models – Managing Complexity in Verification and Validation
Systems Engineering References
About George D. Allen Consulting:
George D. Allen Consulting is a pioneering force in driving engineering excellence and innovation within the automotive industry. Led by George D. Allen, a seasoned engineering specialist with an illustrious background in occupant safety and systems development, the company is committed to revolutionizing engineering practices for businesses on the cusp of automotive technology. With a proven track record, tailored solutions, and an unwavering commitment to staying ahead of industry trends, George D. Allen Consulting partners with organizations to create a safer, smarter, and more innovative future. For more information, visit www.GeorgeDAllen.com.
Contact:
Website: www.GeorgeDAllen.com
Email: inquiry@GeorgeDAllen.com
Phone: 248-509-4188
Unlock your engineering potential today. Connect with us for a consultation.